






One of our manufacturing clients sent an NPS survey after every completed project. Every project ended with the same question: "How likely are you to recommend us?"
It seemed like the right question, but it wasn't giving the team the feedback they needed.
They switched to CSAT, which generated more responses, and the feedback became much more specific.
This particular experience underscored something we see often: brand performance metrics matter most when they help teams make better decisions.
Gartner research found that while 57% of brand leaders conduct brand health assessments, only 21% consider the insights actionable.
We’ve run into the same challenge with clients. The dashboard gets updated. The meeting ends. Six months later, the same questions come up again. That's a sign that the metrics aren't answering the business' questions.
Defining Brand Performance Health
For many executives, brand health is still associated with an annual brand study that's presented once and rarely revisited. The truth is it's really an ongoing part of your brand experience strategy.
Brand performance health connects what customers think about your brand with how the business performs. No single metric tells the whole story. Brand health comes into focus when customer perception, behavior and business performance all point in the same direction.
Unlike a one-time brand study, it lets you track those relationships over time.
Why Brand Performance Health Matters
Marketing leaders have more to keep track of than they did a few years ago. Buyers spend more time researching on their own, media budgets are spread across more channels and every marketing dollar faces more scrutiny.
Trust has a funny way of showing up in the numbers. It gets a little cheaper to acquire customers. Repeat purchases become more common. Holding your price gets easier.
Strong brand health tends to lead to:
- Stronger market share when a competitor drops prices
- Repeat purchases that don't need a promotion
- Higher conversion from branded search traffic
- More momentum behind new product launches
Three Pillars of Brand Performance Health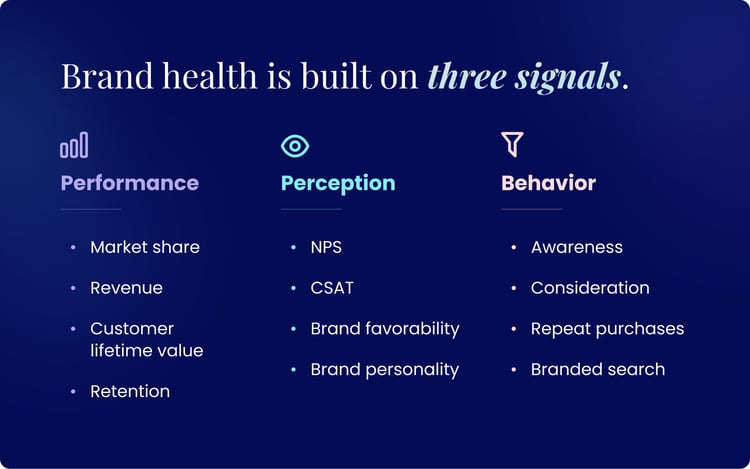
Revenue rarely responds when customer sentiment starts to decline until it’s too late. Looking beyond financial metrics makes those changes easier to spot before they affect the business.
Sales, revenue and conversion rates are already sitting in most dashboards. Trust and reputation aren't.
Brand health draws from multiple sources. Survey responses, CRM data, analytics and sales data each provide a different perspective on how customers think, behave and buy. Looking at them together gives you a more complete picture than any single metric can provide.
Performance: What the Brand Delivers to the Business
Performance metrics answer a different question. Instead of measuring how customers feel about the brand, they show how those perceptions translate into business results.
Every leadership team eventually asks the same question: Is the brand contributing to growth?
Brand performance metrics speak to this. Metrics like market share, revenue from branded traffic, customer lifetime value, retention rate and price premium all show whether brand investments are paying off.
Perception: How People Think and Feel About Your Brand
Customers don't hand you trust as a number in a dashboard. You have to piece it together over time. Surveys tell you some of what you need to know, but reviews, social conversations and the questions customers ask before they buy fill in the rest.
NPS, CSAT, brand favorability and personality fit each add another layer of context.
Behavior: What Customers Actually Do
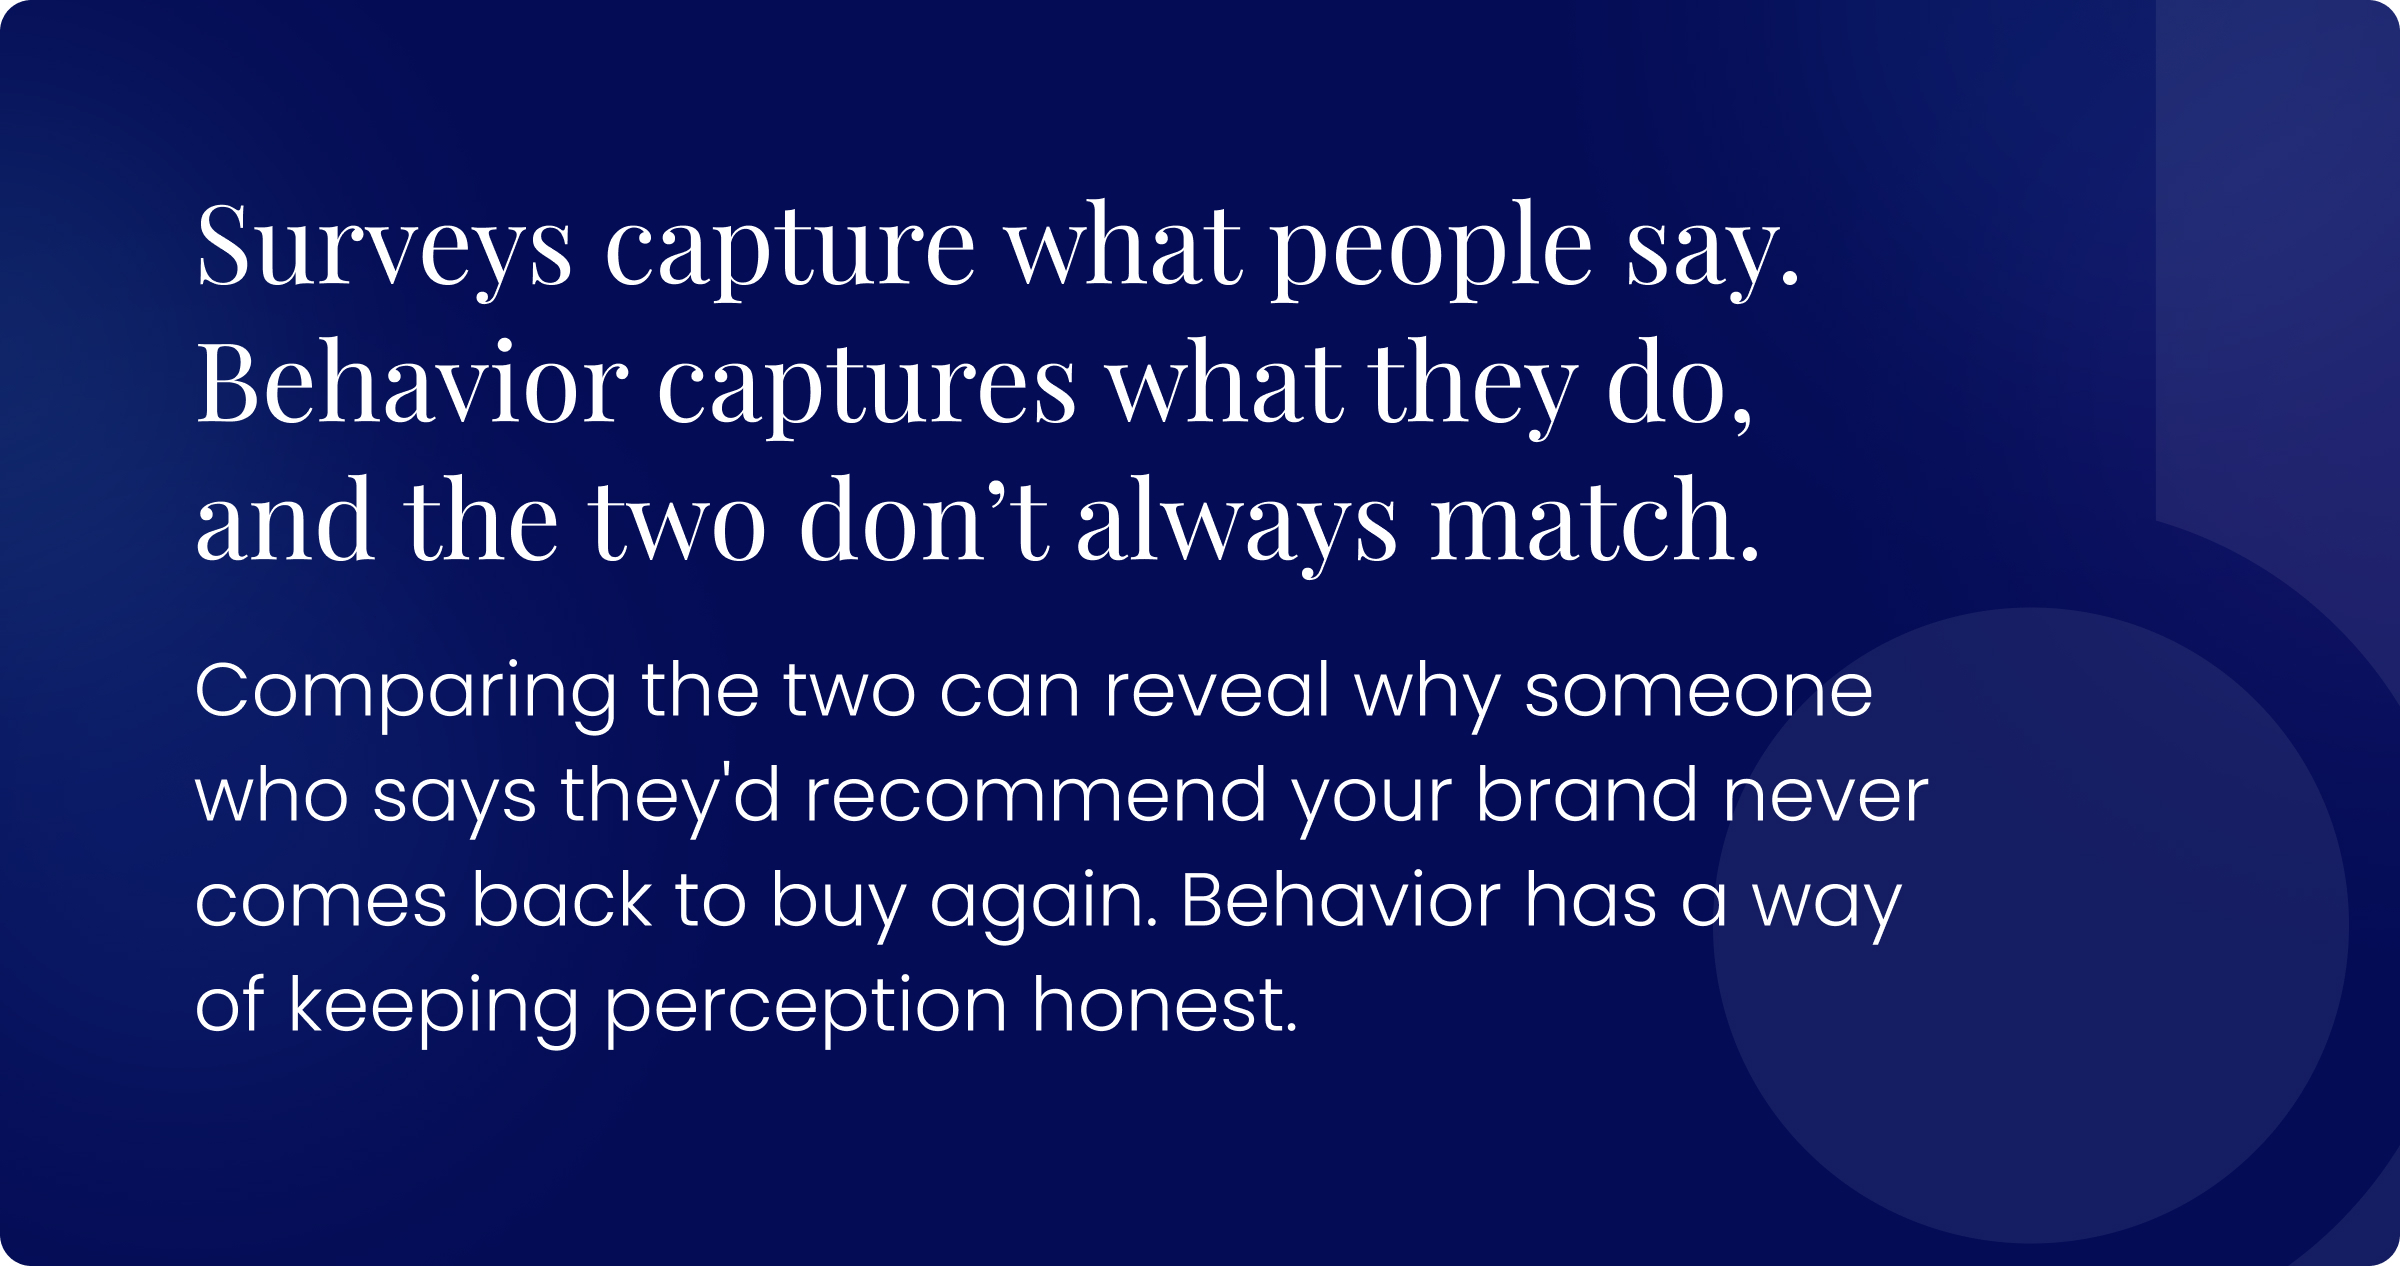
Surveys capture what people say. Behavior captures what they do, and the two don’t always match.
Comparing the two can reveal why someone who says they'd recommend your brand never comes back to buy again. Behavior has a way of keeping perception honest. This includes awareness, consideration, repeat purchases, branded search and other signals that show how customers behave.
Core Brand Health Metrics You Should Be Tracking
Dashboards have a habit of growing. We see teams add new metrics every quarter. Six months later, trendlines are harder to trust when the dashboard keeps changing. Pick a core set of metrics and stick with them.
Brand Awareness
Brand awareness is one of the first metrics teams notice. It's typically measured through brand tracking surveys that ask whether buyers recognize or recall your brand. By itself, though, it doesn't tell you much about whether people are getting any closer to buying.
Awareness still matters, but recognition alone isn't the finish line. It needs to translate into consideration, preference and, eventually, purchase. This is especially true in technology content marketing, where high traffic doesn't always translate into stronger brand preference or revenue.
Around 400 respondents each quarter is a good starting point for national brands. Smaller audiences can still give you a reliable read on awareness, provided when you're surveying the right people consistently.
Bigger isn’t necessarily better: a larger sample isn't automatically a better one. The people you're surveying should reflect the audience you're trying to understand.
Customer Satisfaction (CSAT)
Switching from NPS to CSAT improved response rates. The question matched the experience the team wanted to measure. More importantly, it gave them feedback they could use.
Send the survey while the experience is still fresh. Calculate the score as the share choosing one of the top two positive options, and break it out by channel and customer type so friction points don't get masked by averages.
Net Promoter Score (NPS)
NPS measures long-term loyalty and advocacy through one question, likelihood to recommend on a 0 to 10 scale, promoters minus detractors. We rarely look at NPS by itself. We compare it with service quality, retention and customer feedback to understand what's driving the score. A five-point swing from one quarter to the next is a good reason to ask what changed and why.
Brand Usage and Frequency
How often does someone buy from you compared with other brands they're considering? Increasing purchase frequency among existing customers can have a bigger impact on revenue than adding new light buyers. Customer lifetime value shows whether repeat purchases are translating into long-term business value.
Brand Preference and Consideration
Consideration asks who a customer would seriously think about buying from next. Preference asks who they'd pick first, given all the options in front of them. When consideration rises but preference or actual purchases don't follow, look at pricing, availability or the product itself before blaming visibility.
Brand Equity and Perceived Value
Price is one of the fastest ways to test brand equity. We also look at whether customers are willing to pay a premium, how they rate quality compared to competitors and whether pricing holds up without relying on discounts. Track the results over time to see whether your brand can maintain pricing even when competitors discount.
Market Share and Mental Market Share
Market share comes from sales data and industry reports. Mental market share, how often your brand comes to mind when someone's deciding what to buy, comes from brand tracking surveys.
Some brands have plenty of awareness but still struggle to grow because they aren't the brand buyers think about when it's time to purchase.
Measuring Brand Health in Practice
Brand tracking systems fail before a single survey goes out because the team never defines which question the data needs to answer. Start there. Pick the objective, choose brand performance metrics tied directly to it, map the data flow, build a dashboard your team will use consistently.
Tie Brand Health Metrics to Clear Business Goals
Two points of market share by the end of 2026 calls for different metrics than cutting churn 15%. Churn traces back to NPS, CSAT and whatever's driving perceived value. Write the connection down on one page, share it with leadership.
Build a Brand Performance Health Dashboard
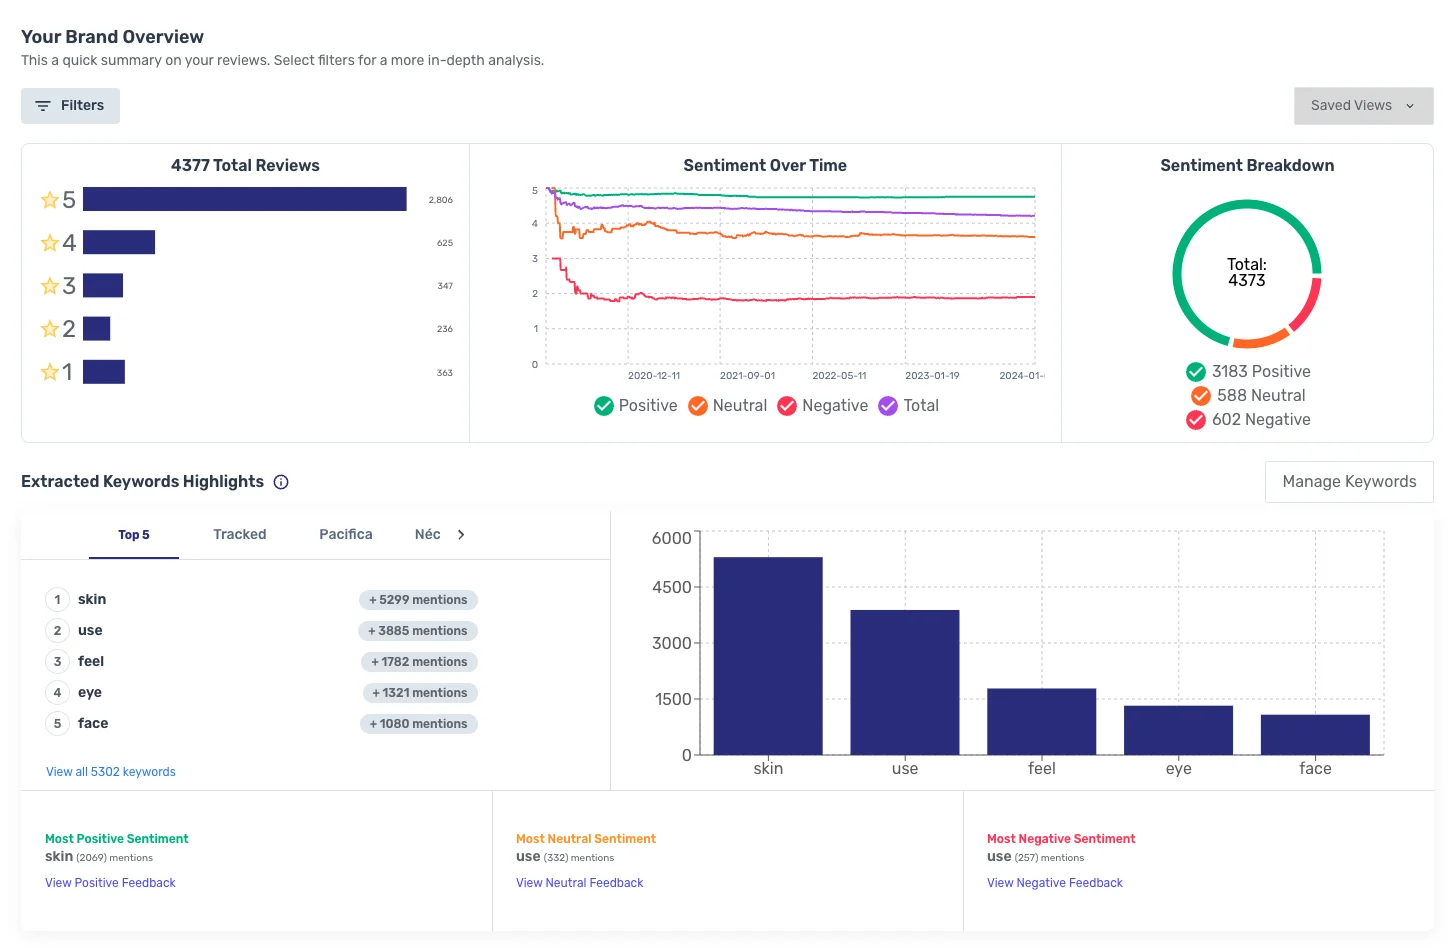
Keep the dashboard simple. Show trends over time, compare performance against competitors and highlight metrics that need attention. We'd rather see a dashboard that gets reviewed every month than one packed with metrics nobody looks at. Those trends become much more meaningful when they're paired with customer feedback, sales conversations and business context.
This includes dashboards that track both technology content marketing performance and broader brand performance metrics, so teams can see how content contributes to growth over time. When we review reporting with clients, the best conversations go beyond marketing. Sales, customer success and product all bring a different perspective.
For example, sales hears different objections than customer success. Comparing those conversations explains why the numbers changed in the first place.
Using Brand Health Insights To Inform Your Marketing Strategy
Set aside time to review the numbers as a team. Decide what changed, why it changed and whether anything needs to change because of it.
Scenario 1: High Brand Awareness, Weak Customer Conversion
A campaign increases awareness, but conversions don't move with it. When we see awareness climb without a lift in conversions, we tend to look at consideration, pricing and on-site behavior before changing the campaign itself.
Scenario 2: Strong Satisfaction, Low Loyalty and CLV
CSAT looks strong, but repeat purchase and lifetime value lag behind it. We've seen strong CSAT scores mask loyalty problems before.
Customers were happy with individual experiences, they just didn't have a compelling reason to come back. That's when we start looking at loyalty programs, competitive pressure and what gives customers a reason to come back.
Scenario 3: Declining Brand Sentiment Amid Stable Sales
Most of the time, customers break the news before your revenue reports do. It starts with a support ticket, a review or a conversation your team has every day.
If sentiment starts to slip, don't wait for revenue to tell you there's a problem. Read through customer feedback, look for patterns and keep tracking sentiment as you make improvements.
The Question Behind Every Metric 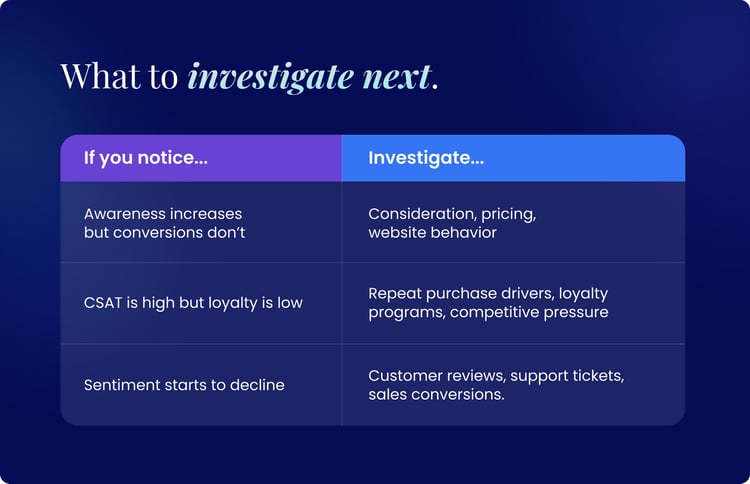
Changing one question gave our client better feedback almost immediately.
Every metric should help your team answer a question or make a decision. If it doesn't, take it off the dashboard.
Is your team collecting brand metrics but still struggling to turn them into better decisions? We'd love to help. Let's start the conversation.


Brent Sirvio